Post by jamesp on Jun 2, 2017 21:20:11 GMT -5
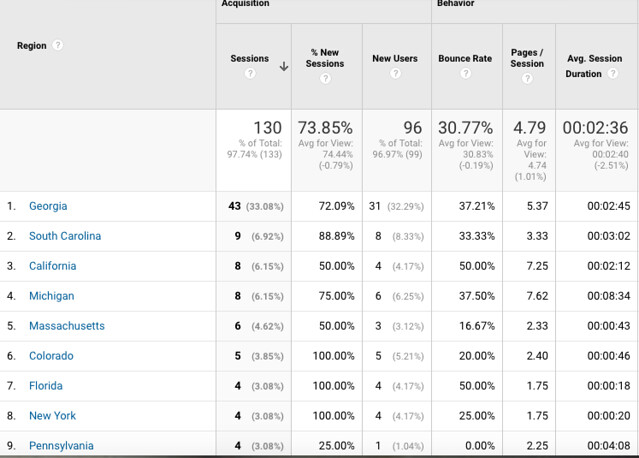
This is a screen shot for 7 days of my fire pit website. It averages about 20 visits per day in the past month. Not many.
It appears that many of the visits are direct according to my clients. Meaning they had intent to find my site or a fire pit.
I have also learned that they see images and click on the image. Which often leads to a visit because I tagged my photos 'firepitsatlanta.com'.
Or the photo is a Houzz or Etsy photo which takes them to those commerce sites that I am a member. Commerce sites slam the internet with photos. As does pinterest.
This image situation is a key player. Images sell.
Note that Georgia gets the most visits. The SEO contractor set my site up for local advertising; it is very effective and inexpensive.
Top 9 states for 7 days:

First off, Georgia, CA, MI, MA, and PA had people that returned to the web site for a 2nd peek.
GA- 43-31=12 return visits
CA- 8-4=4 return visits
MI- 8-6=2 r v
MA- 6-3=3 r v
PA- 4-1=3 r v
Conclusion, those return visitors often generated sales. They always do. They are serious. That is the most important statistic, simple. Easy to see on the chart at a glance.
The next one is session(visit) duration time. Average time... Longer than 2 to 3 minutes is good.
GA, SC, CA, MI and PA scored well. About the same states that did return visits. A verification.
Then the 'pages viewed per session. Same states viewed 2-7 pages. Other states looked at multiple pages.
Just tells you they scrolled thru your site.
The bounce rate is simple too. 100% bounce rate means they passed by you quickly. Perhaps an accidental landing or they quickly had no interest.
Low bounce rate good. 25% 50%
So a glance at the analytics on Thursday or Friday often gives a good idea of (weekend) purchases. People often shop at work, purchase on weekend.
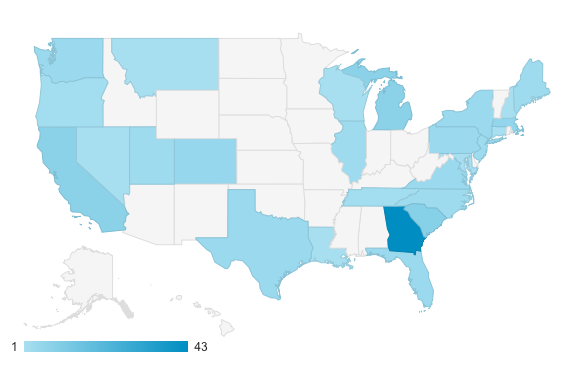
The above chart has the locations of your visitors. The darker the blue color the more visitors. It is fairly repetitive, same states.
7 days, 27 states:

Idaho may have levied regulations about wood burning fire pits due to dry conditions. They inquire about gas burning pits quite often.
Mention of regulations about burning wood and the danger of starting a fire.
Could end up being the demise of wood burning fire pits in dry or fire sensitive territories.
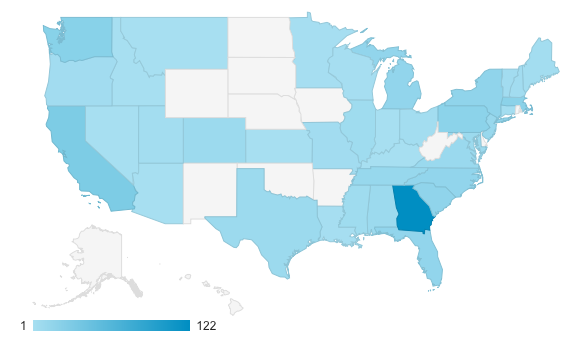
Visitors for the last 30 days. states around the Great Lakes, the east, California and Washington state are the power buyers.
Washington state is a state full of pyros, they by far order more per capita. You Californians are also big fire burners.

It appears that many of the visits are direct according to my clients. Meaning they had intent to find my site or a fire pit.
I have also learned that they see images and click on the image. Which often leads to a visit because I tagged my photos 'firepitsatlanta.com'.
Or the photo is a Houzz or Etsy photo which takes them to those commerce sites that I am a member. Commerce sites slam the internet with photos. As does pinterest.
This image situation is a key player. Images sell.
Note that Georgia gets the most visits. The SEO contractor set my site up for local advertising; it is very effective and inexpensive.
Top 9 states for 7 days:

First off, Georgia, CA, MI, MA, and PA had people that returned to the web site for a 2nd peek.
GA- 43-31=12 return visits
CA- 8-4=4 return visits
MI- 8-6=2 r v
MA- 6-3=3 r v
PA- 4-1=3 r v
Conclusion, those return visitors often generated sales. They always do. They are serious. That is the most important statistic, simple. Easy to see on the chart at a glance.
The next one is session(visit) duration time. Average time... Longer than 2 to 3 minutes is good.
GA, SC, CA, MI and PA scored well. About the same states that did return visits. A verification.
Then the 'pages viewed per session. Same states viewed 2-7 pages. Other states looked at multiple pages.
Just tells you they scrolled thru your site.
The bounce rate is simple too. 100% bounce rate means they passed by you quickly. Perhaps an accidental landing or they quickly had no interest.
Low bounce rate good. 25% 50%
So a glance at the analytics on Thursday or Friday often gives a good idea of (weekend) purchases. People often shop at work, purchase on weekend.
The above chart has the locations of your visitors. The darker the blue color the more visitors. It is fairly repetitive, same states.
7 days, 27 states:

Idaho may have levied regulations about wood burning fire pits due to dry conditions. They inquire about gas burning pits quite often.
Mention of regulations about burning wood and the danger of starting a fire.
Could end up being the demise of wood burning fire pits in dry or fire sensitive territories.
Visitors for the last 30 days. states around the Great Lakes, the east, California and Washington state are the power buyers.
Washington state is a state full of pyros, they by far order more per capita. You Californians are also big fire burners.


